Waterfall Charts
by fortmarinus
Are you looking for an easy to use, versatile Waterfall Chart template for Microsoft Excel?
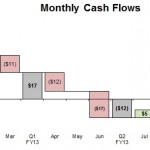
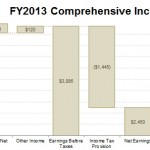
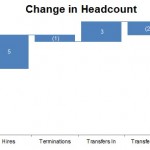
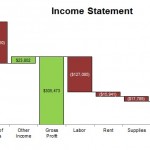
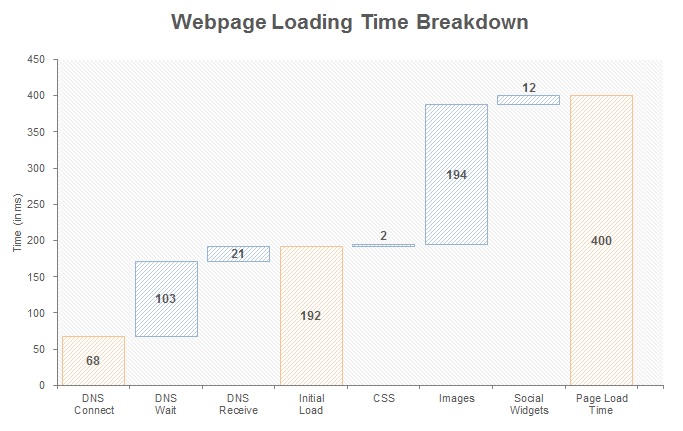
The Waterfall Chart, also known as a Bridge, a Walk, flying bricks, or a Mario Charti, is a most useful visualization for a variety of applications. It can be used to ‘walk’ from a beginning value to an ending value, show the parts of a whole, show changes over time, and more. While Microsoft Excel does not provide a built-in solution for creating this type of chart, Fort Marinus presents a free template.
Please enjoy and comment or email suggestions.
_______________________________________________________________________________________
Marinus’ Waterfall Chart Template for Excel (v4.122) 2014 06 26 NEW!
- No Add-ins, just a good old Excel Worksheet
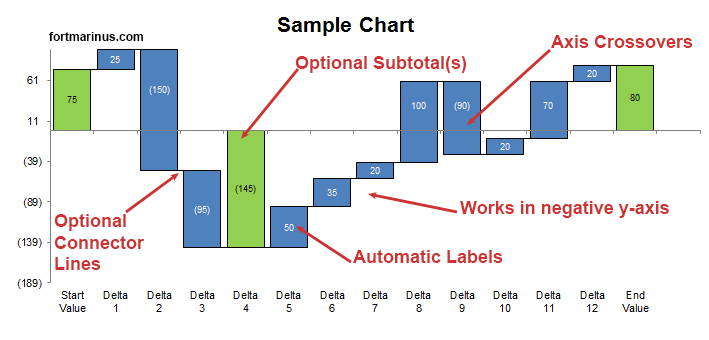
- Ability to show positive and negative changes above AND below zero! (axis crossovers)
- Automatic labeling of bar elements
- Ability to specify multiple ‘Subtotal’ (or ‘Anchor’ or ‘Middle’) columns
- Ability to toggle ‘connector lines’ between bar elements
- Convenient formatting shortcuts
- Plus, all the usual Excel formatting customizations
_______________________________________________________________________________________
Examples Gallery
_______________________________________________________________________________________
Acknowledgements
- Thanks to Liam Bastick at SumProduct for creating an excellent walkthrough on waterfall chartsii
- Thanks to Aaron Henckler at Chandoo.org for creating an excellent tutorial on waterfall chartsiii
- Thanks to Rob Bovey at AppsPro for creating a very useful add-in for labeling chartsiv
_______________________________________________________________________________________
References:- Waterfall Chart http://en.wikipedia.org/wiki/Waterfall_chart [↩]
- Waterfall Charts http://www.sumproduct.com/thought/waterfall-charts [↩]
- Excel Waterfall Charts http://chandoo.org/wp/2009/08/10/excel-waterfall-charts/ [↩]
- The XY Chart Labeler http://www.appspro.com/Utilities/ChartLabeler.htm [↩]
