In Michael Hartl’si Tau Manifestoiiiii, he addresses a criticism of the Tau formulation which points out that the -form of Euler’s equation only relates 4 fundamental constants (e, i, circle constant, and 1), while the
-form relates 5 (despite needing to be re-arranged to do so). In response, he jokingly tacks on a trivial ‘+0’ to the
-form to put it on par with the
-form.
Re-arranged Pi form |
Trivially Modified Tau form |
Full Pi form |
Full Tau form |
However, all joking aside, is a complex number which evaluates to the complex number (1 + 0i). Thus, it is not trivial to represent the zero, in fact, it is thoroughly correct to do so. Conversely, the cleverly re-arranged
-form is even uglier than previously thought, as it breaks up its own complex number evaluation (-1 + 0i) and places half of it on either side of the equation.
Both forms properly include a zero, but the modified -form breaks the symmetry of the solution, while the
-form maintains its symmetry without modification.
Now, as a disclaimer on the debate, I believe that the debate is not about choosing a constant or a symbol that makes equations look prettier; this is utterly secondary and wholly counterproductive. The debate is about the proper definition of the fundamental circle constant. Which, is
, obviouslyiv.
“I appeal to you, brothers, by the name of our Lord Jesus Christ, that all of you agree, and that there be no divisions among you […]” – 1 Corinthians 1:10.i
Today, there are about 2.2 billion Christians worldwide ii and over 350 Christian movements or denominationsiii. Much ink and blood has been spilled regarding these divisions.
Those who are slightly familiar with the history of Christianity may recall at least three major historical events:
A cursory glance at history suggests that the Christian church was basically a homogeneous body until the Great Schism. To some extent, this is true after the 4th century, when Emperor Constantine legalized Christianity in the Roman Empireiv and Emperor Theodosius made it the official State Religionv.
However, upon further inspection, one will find that the situation is not so clear. The chart below illustrates historical origin of the various Christian groups or branches who claim to be descended from the State Religion of the Late Roman Empire. Technically, these churches claim to be (or be a part of) the ‘one, holy, catholic and apostolic Churchvi.
The scope of this illustration is restricted to the Roman Catholic Church, the Eastern Orthodox Churches, The Oriental Orthodox Church, the Church of the East, and certain other relevant historical communities. The chart notably excludes the Protestant groups, including the Church of England. It is also lacking a thorough examination of pre-Constantinian Christian communities. Liturgical families or rites are also highlighted.
The chart takes the form of a timeline, beginning from the first century to the present day (left to right).
Sometimes finance deals with negative quantities that become less negative over time. For example, consider a profit/(loss) of ($50M) in year 1 that becomes a profit/(loss) of only ($1M) in year 4. If we apply the traditional formulas for Percent Change and Compound Annual Growth Rate (CAGR), we find that the results do not align with common-sense interpretation. Beginning with % Change, the usual formula is:
, plugging in our example values:
Common-sense says our profit is increasing, therefore we expect +98%. Using an absolute value in the denominator adjusts the formula in such a way that is consistent with the common-sense interpretation.
, plugging in our example values:
_______________________________________________________________________________________
Now, the usual formula for CAGR is:
, plugging in our example values:
Again, the common sense interpretation expects a positive growth rate since profit is increasing. We can not, however, simply reverse the sign as with % change. Let us re-write CAGR to illustrate the solution. This form is identical to the usual formula. Re-arranging it in this way allows us to see that % Change is embedded in the formula:
If we replace % Change with Adjusted % Change, we will have an Adjusted CAGR that yields the growth rate consistent with the common-sense interpretation:
Therefore,
, plugging in our example values:
_______________________________________________________________________________________
An NTC (Negative Temperature Coefficient) Thermistor is a passive electrical component whose resistance varies inversely with temperature.i It is often used as a temperature sensor. The relationship between resistance and temperature can be described with the ‘beta’ formula.
In this experiment we will show how to use the National Instruments myDAQii in conjunction with LabVIEWiii to create a Virtual Instrument that automatically and continuously measures the temperature. It is noted, however, that myDAQ/LabVIEW are not needed for the simplest form of this exercise, which can be performed with just a multimeter and a thermistor.
_______________________________________________________________________________________
The relationship between resistance and temperature is given by the ‘beta’ equationvi, a simplified approximation of the Steinhart-Hart equation.vii The Beta value (B), the Reference Temperature (T0), and the Reference Resistance (R0) are given in the thermistor’s datasheetviii. The component’s Resistance (R) is measured by an ohmmeter and then Temperature (T) can be solved for.
The ‘Beta’ Equation:
Solving for T,
Simply attach the myDAQ ohmmeter probes to the thermistor which can be placed optionally onto the breadboard. The resistance will be measured by the myDAQ and sent to LabVIEW for processing.
The Virtual Instrument Front Panel allows the user to input the Beta Value, the Reference temperature, and the Reference Resistance, again taken from the Datasheet. The resistance measured by the myDAQ is also displayed. The interface graphically outputs the calculated temperature in Kelvin, Celsius, and Fahrenheit.
The block diagram is the programming language of LabVIEW and the back-end of the Front Panel. Each component on the Front Panel is graphically represented in the block diagram. The image shows how the variable inputs from the front panel and the myDAQ are passed through a graphical representation of the beta formula and then output as temperature values.
If myDAQ and LabVIEW are not available, Excel can be used to calculate the temperature.
In this experiment, we measured the temperature under the following scenarios: room temperature, surrounding the thermistor with a bag of ice, and grasping it while blowing hot breath on it. Indeed, the thermistor’s resistance is inversely related to temperature. This is a relatively easy experiment that can serve as a good introduction to circuit elements, data acquisition, and LabVIEW programming. Enjoy!
_______________________________________________________________________________________
Marinus’ National Instruments LabVIEW Thermistor Calculator Virtual Instrument (v1.0) 2014 01 31
Marinus’ Thermistor Temperature Calculator in Excel (v1.0) 2014 01 31
_______________________________________________________________________________________
Are you looking for an easy to use, versatile Waterfall Chart template for Microsoft Excel?
The Waterfall Chart, also known as a Bridge, a Walk, flying bricks, or a Mario Charti, is a most useful visualization for a variety of applications. It can be used to ‘walk’ from a beginning value to an ending value, show the parts of a whole, show changes over time, and more. While Microsoft Excel does not provide a built-in solution for creating this type of chart, Fort Marinus presents a free template.
Please enjoy and comment or email suggestions.
_______________________________________________________________________________________
Marinus’ Waterfall Chart Template for Excel (v4.122) 2014 06 26 NEW!
_______________________________________________________________________________________
Examples Gallery
_______________________________________________________________________________________
Acknowledgements
_______________________________________________________________________________________
References:
“And he spoke to them, propounding to them themes of music; and they sang before him, and he was glad.” Ainulindalë 1:2
The Silmarillion is a collection of stories from Tolkien’s legendarium. The first part, called Ainulindalë, is a Creation myth. The story is written in prose and reads a bit like Scripture. I thought it would be interesting to simply format the work to look more like a real book of scripture. I added chapter headings, verse line numbers, and annotations/references as one might find in a Bible. I think it makes the work fun to read. And, it also allows one to use Chapter and Verse to quote a specific line.
A resource for calculators, simulators, charts, formulas, and secrets.
Conquer the Galaxy, One Planet at a Time. In the near distant future, space exploration has evolved into a much more sophisticated nature as planets are colonized by humans in a fierce battle for resources and influence. Immerse yourself in intergalactic diplomacy as you manage your bases and natural resources while waging war against enemies.
Download: iOS Android
Note: This post was made for Galaxy Empire version 1.6. The information here is out of date. I do not plan on updating it. Thanks for your interest.
_______________________________________________________________________________________
Marinus’ Galaxy Empire Output Formulas and Calculator (v2.0) 2013 01 13
Fort Marinus has discovered the secret Galaxy Empire Output formulas for the Metal Mine, Crystal Mine, Gas Mine, Solar Plant, Solar Satellites, and the Fusion Reactor. With these formulas and associated tables, one can know the units of Gas, Metal, Crystal, and Energy produced per hour.
_______________________________________________________________________________________
Marinus’ Galaxy Empire Resource Calculator (v2.0) 2013 01 05
This tool allows you to calculate the amount of time it will take to gather a certain amount of resources. It will also show how many resources you will have gathered after a certain amount of time.
_______________________________________________________________________________________
Marinus’ Galaxy Empire Battle Calculator (BETA v0.1) 2012 10 26
This tool allows you to simulate the combat of Galaxy Empires. Input the number of each type of ship for each combatant and see who wins. Note: This calculator is in beta form, the formulas are not exactly correct, but they are close.
_______________________________________________________________________________________
Marinus’ Galaxy Empire Upgrade Cost Charts (v1.0) 2013 01 01
This Excel spreadsheet shows the costs for buildings and upgrades up to Level 30. It also explains the cost formula below in more detail.
Use this formula and schedule to calculate the cost of any building/technology upgrade.
_______________________________________________________________________________________
Fuel Conversion Rate (v4.0) 2013 01 01
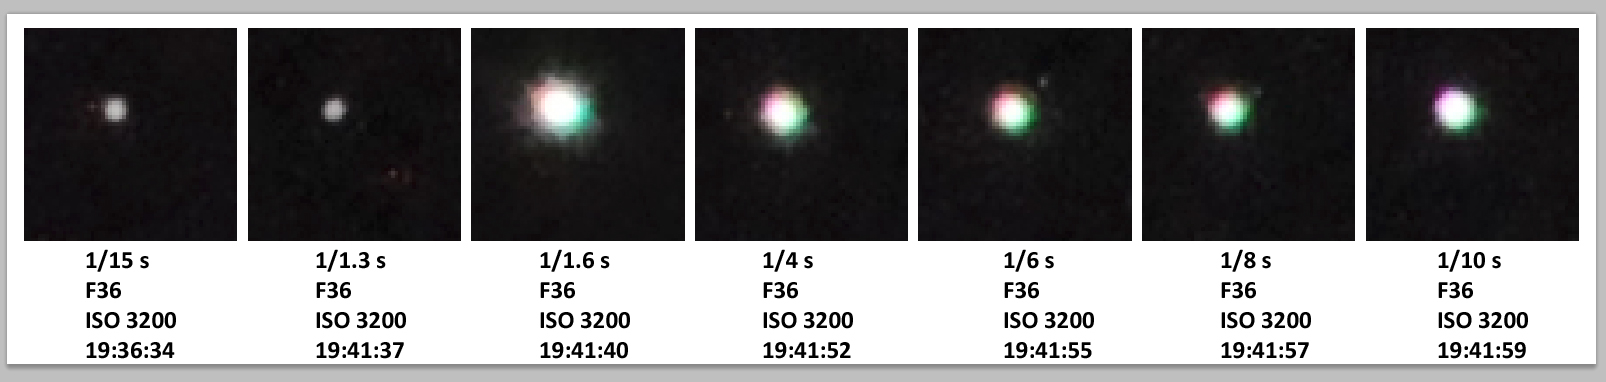
Whenever attacking an NPC planet, fuel (gas) is spent and loot is gained. The ‘Units of Loot gained per Unit of Fuel (gas) spent*’ is called the Fuel ‘Conversion’ Rate. Apparently, sending 20 ships or less results in a gain of 1.5 Metal plus 1.5 Crystal for every 1 unit of Fuel (Gas) spent. After 20 ships, the amount of loot gained decreases exponentially (?) along a ‘minimum loot curve’, however there seems to be a ‘chance’ to gain the maximum loot. *also the number of Ships sent
Takeaways:
– It is most efficient to send as few ships as possible.
– Sending more than 300-400 ships results in a net Loss of resources.
Still unknowns:
– What is the formula for the minimum loot curve?
– What is the ‘chance’ formula to gain minimum or maximum loot, or somewhere in-between?
Notes:
These data were collected by attacking the Level 2 or Level 3 ‘The Purged’ planet with varying numbers of Light Fighters. No ships were lost in the attacks. Initial observations of repeating this experiment with Destroyers attacking the Level 11 ‘Pollution Origins’ planet show that sending 50 or less ships is highly likely to yield a maximum loot gain of 1.21 units of Metal plus 1.21 units of Crystal for every unit of Fuel (gas) spent. Sending more than ~250 ships results in a net Loss of resources.
_______________________________________________________________________________________
“मधु नक्तमुतोषसो मधुमत पार्थिवं रजः | मधु दयौरस्तु नः पिता || ” – Rig Veda I.90.7.
“Sweet be the night and sweet the dawns, sweet the terrestrial atmosphere; Sweet be our Father Heaven to us.”
Father Heaven in the quote above is ‘Dyauṣ Pitā’ in Sanskrit. The same deity called ‘Zeus Pater’ by the Greeks and ‘Iuppiter’ by the Romans.i When the ancients looked into the skies, they were so impressed by the planets that they associated the celestial bodies with their own gods.
Tonight, the gods have blessed us with clear skies and a celestial treat: The Moon, Jupiter, and Venus are clearly visible to the naked eye. The planets are particularly striking in an urban environment where light pollution obscures all but the brightest luminaries.
Unfortunately, these photos were taken without the benefit of a telescope.
I would like to think I caught an orbiting moon or two around Jupiter, but the peripheral dots are probably just artifacts from the camera, the digital zoom, and the shaking of the wind.
References:For Christmas, I received John Evans’ “Adventures with Pinhole and Homemade Cameras” book. It is actually a book and kit with materials to build your own Pinhole camera. The final product is a cardboard film camera whose lens is a brass plate with a .15mm laser-cut hole. Ultimately, I didn’t built the camera. Instead, I harvested the brass plate and mounted it to a spare body cap for use on my digital camera. Here’s what I came up with.
Instead of a glass lens, a Pinhole Camera uses a very small hole to let in shafts of light. Since the hole is so small, exposure times need to be longer than a typical photograph. The resulting images are often soft, blurry, and abstract, but not always. This is my first time playing around with one, we’ll see what I can do with it. MORE PICTURES TO COME!
The daytime pinhole picture looks like a low quality photograph. The nighttime picture of a bookcase looks more like I snapped a photo of a ghost.
© Fort Marinus . Powered by WordPress and Manifest